Guest Profiling Guide
In this guide, we'll explore how to effectively profile guest code within the RISC Zero zkVM, offering insights and tools to improve performance.
We'll be using a guest program with three different implementations of the Fibonacci sequence calculation to provide a base profile to explore. You can find all the code used as example in the profiling example.
Background
Profiling tools, like pprof and perf, allow collecting performance information over the entire execution of your program, and help create visualizations for the performance of your program. RISC Zero has experimental support for generating pprof files for cycle counts.
Sampling CPU profilers, as implemented by pprof and perf, provide a view of where your program is spending its time. It does so by recording the current call stack at a sampling interval. RISC Zero provides a "sampling" 1 CPU profiler for guest execution.
Usage
Step 1: Prerequisites
First, follow the installation guide if you don't already have the RISC Zero tools installed.
Additionally, you will need to install Go, which bundles with it the pprof tool.
Step 2: Running
Run the Fibonacci profiling example with:
RISC0_PPROF_OUT=./profile.pb RUST_LOG=info RISC0_DEV_MODE=1 RISC0_INFO=1 cargo run
The above command will run the Fibonacci computation for 1000 iterations and
write the profiling output to profile.pb. Use the environment variable
RISC0_PPROF_OUT to set to the desired output path for the profiling data.
We recommend running profiling in dev mode to avoid unnecessary proving time.
Step 3: Visualization
To visualize the profile using pprof, run:
go tool pprof -http=127.0.0.1:8000 profile.pb
Then navigate to http://localhost:8000 in your browser.
You can find much more information about how to use pprof in the official
pprof documentation.
Exploring the Example Profile
There are three different Fibonacci sequence calculation methods provided in the profiling example:
fibonacci_1: A basic iterative method.fibonacci_2: An optimized iterative method that attempts to batch computation.fibonacci_3: A matrix exponentiation approach, which is a fast method to compute Fibonacci numbers.
The guest code reads the number of iterations from the host, computes the Fibonacci number using all the above methods, and finally commits the answer back to the host.
Below is the example flamegraph you will see by opening http://localhost:8000/ui/flamegraph, after running the steps above.
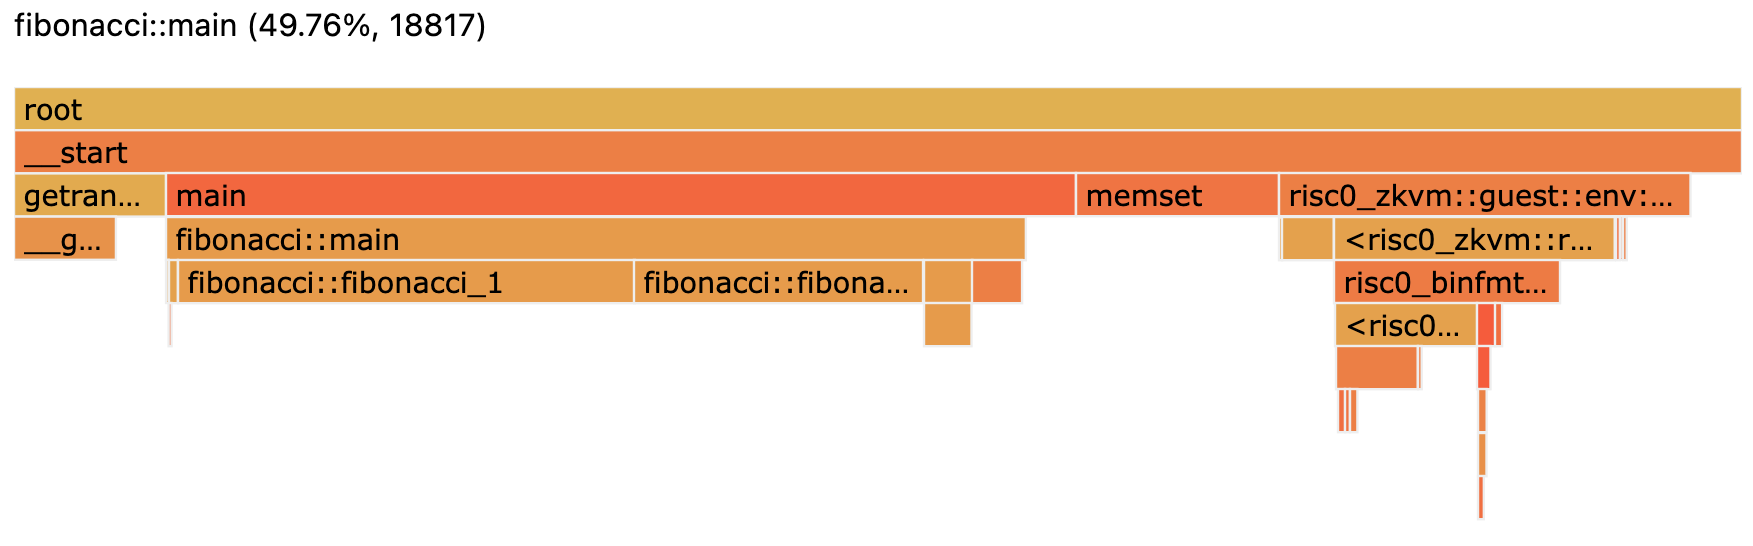
When you visualize the profiling data, you can see the relative performance in terms of cycle count of the three Fibonacci implementations. This can be helpful in understanding the efficiency of various algorithms and their performance implications.
Use the pprof web interface to compare the performance of the 3 Fibonacci implementations. Refer to the pprof docs for more information about the web interface.
Inline Functions
Your compiler may end up inlining a lot of functions which can make it difficult to see what is
going on in the profile sometimes. If you have compiled your program with debug symbols you can
enable inline function tracking in the profiler by setting
RISC0_PPROF_ENABLE_INLINE_FUNCTIONS=yes. This will make the profile more detailed, but it comes at
a cost of slowing down the profiler.
Footnotes
-
Here "sampling" is in quotes because the profiler actually captures the call stack at every cycle of program execution. Capturing a call stack on every cycle of execution is not done in most programs on physical CPUs for a few reasons:
- It would be cost prohibitive to do so for all but quite short program executions.
- Introducing such heavy profiling would actually alter the performance characteristics in significant ways.
In zkVM execution, executions are generally short and all execution is synchronous and is not subject to any deviations in behavior due to measurement overhead. ↩