Guest Optimization Guide
RISC Zero's zkVM is designed and built to act like a physical CPU. We did this so you could use general purpose languages (e.g. Rust) and general purpose tools (e.g. Cargo, LLVM). Generally, you can apply general purpose optimization techniques too!
In this guide, we'll cover optimization of zkVM guest programs. We'll discuss when you can apply common techniques from other contexts, and when you need a new approach.
Background
What Is the zkVM, Really?
The zkVM is essentially a CPU.
In particular, it is an implementation of the RISC-V architecture (specifically riscv32im), similar to how your laptop's CPU may be an implementation of an x86 or ARM architecture. This biggest difference is that the zkVM is implemented with arithmetic circuits, in software, instead of circuitry made from silicon and copper.
What Is a "Cycle"?
Both in the zkVM and on physical CPUs, the cost of an operation is measured in "clock cycles".
Intuitively, a "clock cycle" is the smallest unit of time in a CPU's operation, representing one tick of the CPU's internal clock and the time it takes to execute a basic CPU operation (e.g. adding two integers). We'll refer to this as a "cycle".
Proving times for the zkVM are directly related to the number of cycles in an execution.
General Techniques and Advice
Start by applying general techniques and best practices for optimizing your code.
The Rust Performance Book is great resource. It's not very long, it covers a range of topics important to performance, and gives applicable advice for optimization. If you are new to optimization, or new to Rust, we recommend you read this guide.
Don't Assume, Measure.
Performance is complex, in the zkVM as on a physical CPU. Don't assume you know what the bottlenecks are. Measure and experiment.
If you make a function 100x faster (or ∞x faster) but it only takes 1% of your execution time, you'll see less than 1% improvement in performance. This is generally referred to as Amdahl's Law, and practically it means you shouldn't waste your time optimizing something that's not the taking a significant portion of execution time.
Measuring by Printing to Console
Starting simple, measure by adding an eprintln! line to your guest code to
measure how long an operation takes, and how many times it is called.
Using env::cycle_count() will tell you the current number of execution
cycles that have occurred in your program.
As an example:
fn my_operation_to_measure() {
  let start = env::cycle_count();

  // potentially expensive or frequently called code
  // ...

  let end = env::cycle_count();
  eprintln!("my_operation_to_measure: {}", end - start);
}
When you run your guest, you'll see a printout of the cycle count each time that
function is called. You can then analyze this data easily with a tool like
counts.
Profiling
Profiling is one of the most important tools for understanding and optimizing your code.
Profiling tools, like pprof and perf, allow collecting performance information over the entire execution of your program, and help create visualizations for the performance of your program. RISC Zero has experimental support for generating pprof files for cycle counts.
Sampling CPU profilers, as implemented by pprof and perf, provide a view of where your program is spending its time. It does so by recording the current call stack at a sampling interval. RISC Zero provides a "sampling" 1 CPU profiler for guest execution.
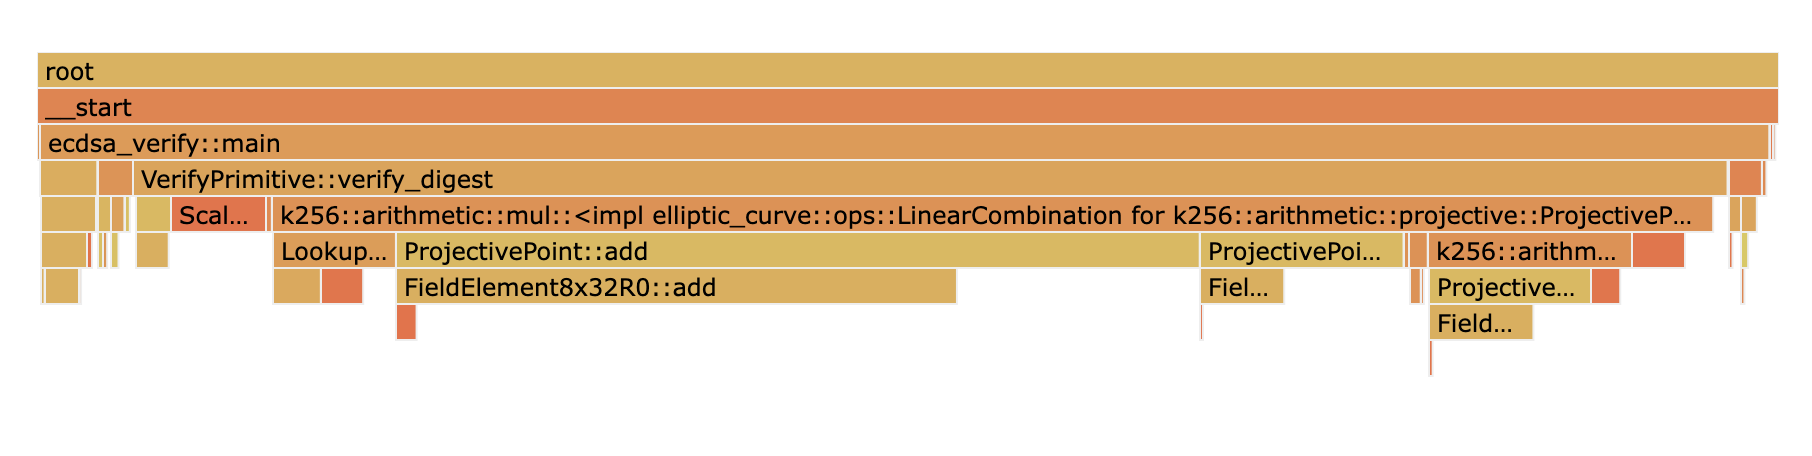
One very useful visualization of this data is as a flamegraph, such as the one below for the ECDSA verification example.
Generate this profile and flamegraph by installing Go and running the following commands:
# In your clone of github.com/risc0/risc0
cd examples/ecdsa
RISC0_PPROF_OUT=ecdsa_verify.pb RISC0_DEV_MODE=true cargo run
go tool pprof -http 127.0.0.1:8000 ecdsa_verify.pb
Open http://127.0.0.1:8000/ui/flamegraph in your web browser to see the flamegraph.
Although it's bundled with Go, the pprof tool can be used with profiles from
programs not written in Golang. pprof has extensive functionality, and the
documentation linked below contains information about the different views
provided, comparing profiles, and much more.
Documentation for pprof: github.com/google/pprof
More information about profiling can be found in the Guest Profiling Guide
Key Differences
Using general purpose advice and tools for optimization will work 80% of the time. But there are some key differences between how physical CPUs and the zkVM operate that can be important to understand when trying to get the best possible guest performance.
This section explains some of the most important differences between a physical CPU and the zkVM, as they relate to guest performance.
Most RISC-V operations take exactly one cycle
Not all operations cost the same amount. An add instruction takes fewer
cycles than a div. This is true for both the zkVM and physical CPUs.
However, the relative difference between instructions is much smaller in the
zkVM. In the zkVM, a div takes twice as long as an add. On a physical CPU, a
div takes 15-40 times as long compared to an add. Practically,
this means if you have a choice between implementing an algorithm with 10
add ops, or a single div. On a physical CPU, choose the add ops. In the
zkVM choose the div.
- Addition, comparison, jump, shift left, load and store all take one cycle.
- Bitwise operations (AND, OR, XOR), division, remainder, and shift right take two cycles.
Note that this means that shift left is no faster than multiplying by a power of two, and shift right is no faster than division. A number of other small optimizations like this, routinely applied by developers and compilers, have no effect in the zkVM.
See the table in the appendix for more information about cycle counts per operation.
Memory Access Costs One Cycle, Except When It Doesn't
RISC-V operations require data to be loaded from memory to registers before
it can acted on (e.g. used as input to an add). It must also be written back
to memory to store the result. Memory loads and stores (i.e. reads and writes)
usually take one cycle.
Memory access, both load and store takes exactly one cycle, except in the case of page-in and page-out operations (discussed below).
Note that relative to a physical CPU, this is extremely fast (in terms of cycles). On a physical CPU even a value in L1 cache takes 3-4 cycles to access. L3 cache takes 30-70 cycles and main memory 100-150. One of the most common bottlenecks in applications is the round-trip time it takes to access a data in memory.
Paging
Every execution of the zkVM starts from an initial memory state. This memory state (a.k.a. image) is referenced by an image ID, which contains a Merkle root committing to all data in memory. For efficiency, data in memory is split into 1 kB pages.
Pages in the zkVM are analogous a page in an operating system, and in particular this term was chosen in reference to memory paging, or swapping, systems. Execution of a program is split into continuation segments. Between segments, the zkVM essentially hibernates, saving all working memory to the host; as a CPU would use a hard drive.
The first time a page is accessed in a segment, it needs to be paged-in, loading it from the host. Confirming the page is correct, the guest verifies a Merkle inclusion proof for the page against the image ID. Note as well that the address of the program counter must be paged-in, as instructions are loaded from memory. These hashing operations required take a number of cycles.
In order to support continuation after the segment ends (i.e. the zkVM "hibernates"), it needs to page-out pages that were modified. Paging-out takes the same number of operations as paging-in, so for the first time any given page is written to in a segment, it is marked as "dirty". At the end of segment execution, every dirty page must be "paged-out" at a cost of 1094 to 5130 cycles. An exception to this rule is the last segment, where no paging out occurs, since there will be no continuation from the last segment.
A page-in or page-out operation takes between 1094 and 5130 cycles; 1130 cycles on average.
The very first page-in or page-out takes longer, 5130 cycles, because it needs to traverse up the page table (i.e. Merkle tree) all the way to the root, which is equal to the image ID. Once a path is verified, it doesn't need to be hashed again, so most page-in operations only need to hash the leaf (i.e. data) page. If a program were to iterate over memory in sequence, it would cost on average 1130 cycles per page, or 1.35 cycles per byte.
If, after profiling your application, you learn page-in and page-out operations are a significant overhead, you can optimize your application by reducing it's memory usage and locality. This will be somewhat similar to optimizing for data locality and L1/2 cache usage. Using fewer pages, using the same page repeatedly instead of a random access pattern, and condensing the range of addresses accessed can all help reduce paging overhead. It's best to experiment.
The Zkvm Does Not Have Native Floating Point Operations
The RISC Zero zkVM does not implement the RISC-V floating point instructions. As a result, all floating point operations are emulated in software. In contrast to integer operations that take 1-2 cycles, floating point operations can take 60-140 cycles for basic operations such as add, subtract, multiply, and divide.
When possible, use integers instead of floating point numbers.
Unaligned Data Access Is Significantly More Expensive
CPUs define a standard size of data for operation; and this is referred to as a word. In RISC-V 32-bit ISA, the size of a word is 32 bits (4 bytes). Memory is always read and stored as words.
When the read or store address is not a multiple of 4 bytes, the operation is
much more expensive. In a simple benchmark, reading an unaligned u32 value
costs 12 cycles, versus 1 cycle for an aligned read.
All allocations will be aligned by default, and the compiler wants to help you, so this should usually not be an issue.
If you are defining structs that containing small primitive typed fields (e.g.
bool, u8, i16) and access this data very frequently, you might consider
paying extra care to the alignment of those fields. Additionally,
if you are slicing into byte arrays, try to do so at word-aligned indices.
When Reading Data as Raw Bytes, Use env::read_slice
When reading input into the guest, env::read is the main API to use. It
automatically deserializes the input bytes into structs, like in this snippet
from the password checker example.
let request: PasswordRequest = env::read();
In the host code, ExecutorEnvBuilder::write function is used to serialize and
write to input struct so that the guest can read it.
let request = PasswordRequest { /* .. */ };
let env = ExecutorEnv::builder()
        .write(&request).unwrap()
        .build()
        .unwrap();
In most cases, these APIs are what you should use to send data to the guest.
However, when you need to read and work with data as raw bytes (or words), it is
more efficient to use env::read_slice or env::stdin().read_to_end. Both
methods do no (de)serialization and so do not need to copy or reinterpret the
input data. Examples of when this may be useful are if you are reading in image
data as bytes, or reading data that is binary encoded from the source like with
CBOR.
Here is a snippet from the Bonsai Governance example showing how to read bytes.
let mut input_bytes = Vec::<u8>::new();
env::stdin().read_to_end(&mut input_bytes).unwrap();
On the host side, ExecutorEnvBuilder::write_slice is used to pass in the bytes.
let input_bytes: Vec<u8> = b"INPUT DATA".to_vec();
let env = ExecutorEnv::builder()
        .write_slice(&input_bytes)
        .build()
        .unwrap();
When You Only Need Part of the Input Data, Try Merklizing It
Some programs only need part of the whole available data. Where's Waldo is an example of this. The full input is an image, but only the part with Waldo in it is needed. Loading and hashing the whole image would be quite expensive, so instead the initial input for the guest is just the Merkle root and each chunk is loaded dynamically. The guest verifies that the chunk is indeed part of the image by verifying the Merkle inclusion proof.
If you are writing a guest with a large input, and only part of it is needed for the computation, consider splitting it into some notion of a chunks and building it as a Merkle tree. You can use the code for Where's Waldo as a starting point.
Cryptography in the Guest Can Utilize Accelerator Circuits
RISC Zero's riscv32im implementation includes a number of special purpose operations, including two "accelerators" for cryptographic functions: SHA-256 and 256-bit modular multiplication. By implementing these operations directly in the "hardware" of the zkVM, programs that use these accelerators execute faster and can be proven with significantly less resources 2.
For more information about cryptography precompiles, cryptography precompiles.
Using the accelerator, a SHA-256 compress operation typically takes 68 cycles per 64-byte block and 6 cycles to initialize. A 256-bit modular multiply takes 10 cycles. This includes basic memory operation cycles, but does not include page-in or page-out operations that are triggered.
Memory Access Is Synchronous
On a physical CPU, memory access is asynchronous to register operations; meaning
arithmetic or logic operations on registers can run while the CPU is waiting for
the result from memory. Because the memory fetch latency is quite large
(100-150x the time to add two registers), this gives rise to techniques such
as prefetching and speculative execution, implemented both at the processor and
application levels.
In the zkVM, all memory operations are synchronous, regardless of if the data is currently paged-in. Memory prefetching does not help (but can hurt) zkVM guest performance.
All Execution Is Single-Threaded
The zkVM has one core and one thread of execution. As a result, there is no need
or use for multi-threading. Using async routines, locking, or atomic
operations in the guest can only slow the program down.
The zkVM has no pipelining or other instruction-level parallelism.
Modern processors have execution pipelines and superscalar architectures designed to execute instructions in parallel. Instruction throughput is much higher when the pipeline is kept full and independent execution units are utilized. CPUs implement out-of-order and speculative execution, among other techniques to achieve this.
By comparison, RISC Zero's riscv32im implementation is very simple. Instructions will be read from the guest program and executed in the order chosen by the compiler.
Developers and compilers often use techniques such as pre-fetching, avoiding branches, or reordering instructions to maximize instruction-level parallelism. These techniques have essentially no effect in the zkVM.
Prover Acceleration
You are probably interested in guest optimization in order to have faster proving times, to reduce compute costs, or both. RISC Zero can leverage hardware accelerators, the ones made of real silicon this time, to accomplish both of these objectives.
With an NVIDIA graphics card, proving can be accelerated through the CUDA
implementation. When running a zkVM application, a compatible version of the
CUDA runtime needs to be installed. When building the zkVM from source, a
compatible version of the CUDA toolkit needs to be installed on the build
machine, and the cuda feature enabled.
TL;DR and Quick Wins
- Profile your applications to find where cycles are being spent.
- Try different compiler settings
- Setting
lto = "thin"is sometimes faster thanlto = "fat"orlto = true. - Sometimes
opt-level = 2is faster than3. Trysandztoo. - Try setting
codegen-units = 1.
- Setting
- When you need a map, use
BTreeMapinstead ofHashMap. - When you need to hash data, use the precompile implementation of SHA-256.
- Look for places where you are copying or (de)serializing data when not necessary.
Appendix
RV32IM Operations with Cycle Counts
Table from https://marks.page/riscv/, with RISC Zero cycle counts added.
| Assembly | Name | Pseudocode | RISC Zero Cycles |
|---|---|---|---|
| LUI rd,imm | Load Upper Immediate | rd ← imm | 1 |
| AUIPC rd,offset | Add Upper Immediate to PC | rd ← pc + offset | 1 |
| JAL rd,offset | Jump and Link | rd ← pc + length(inst)pc ← pc + offset | 1 |
| JALR rd,rs1,offset | Jump and Link Register | rd ← pc + length(inst)pc ← (rs1 + offset) ∧ -2 | 1 |
| BEQ rs1,rs2,offset | Branch Equal | if rs1 = rs2 then pc ← pc + offset | 1 |
| BNE rs1,rs2,offset | Branch Not Equal | if rs1 ≠ rs2 then pc ← pc + offset | 1 |
| BLT rs1,rs2,offset | Branch Less Than | if rs1 < rs2 then pc ← pc + offset | 1 |
| BGE rs1,rs2,offset | Branch Greater than Equal | if rs1 ≥ rs2 then pc ← pc + offset | 1 |
| BLTU rs1,rs2,offset | Branch Less Than Unsigned | if rs1 < rs2 then pc ← pc + offset | 1 |
| BGEU rs1,rs2,offset | Branch Greater than Equal Unsigned | if rs1 ≥ rs2 then pc ← pc + offset | 1 |
| LB rd,offset(rs1) | Load Byte | rd ← s8[rs1 + offset] | 1 if paged-in 1095 to 5131 otherwise |
| LH rd,offset(rs1) | Load Half | rd ← s16[rs1 + offset] | 1 if paged-in 1095 to 5131 otherwise |
| LW rd,offset(rs1) | Load Word | rd ← s32[rs1 + offset] | 1 if paged-in 1095 to 5131 otherwise |
| LBU rd,offset(rs1) | Load Byte Unsigned | rd ← u8[rs1 + offset] | 1 if paged-in 1095 to 5131 otherwise |
| LHU rd,offset(rs1) | Load Half Unsigned | rd ← u16[rs1 + offset] | 1 if paged-in 1095 to 5131 otherwise |
| SB rs2,offset(rs1) | Store Byte | u8[rs1 + offset] ← rs2 | 1 if dirty 1095 to 5131 otherwise |
| SH rs2,offset(rs1) | Store Half | u16[rs1 + offset] ← rs2 | 1 if dirty 1095 to 5131 otherwise |
| SW rs2,offset(rs1) | Store Word | u32[rs1 + offset] ← rs2 | 1 if dirty 1095 to 5131 otherwise |
| ADDI rd,rs1,imm | Add Immediate | rd ← rs1 + sx(imm) | 1 |
| SLTI rd,rs1,imm | Set Less Than Immediate | rd ← sx(rs1) < sx(imm) | 1 |
| SLTIU rd,rs1,imm | Set Less Than Immediate Unsigned | rd ← ux(rs1) < ux(imm) | 1 |
| XORI rd,rs1,imm | Xor Immediate | rd ← ux(rs1) ⊕ ux(imm) | 2 |
| ORI rd,rs1,imm | Or Immediate | rd ← ux(rs1) ∨ ux(imm) | 2 |
| ANDI rd,rs1,imm | And Immediate | rd ← ux(rs1) ∧ ux(imm) | 2 |
| SLLI rd,rs1,imm | Shift Left Logical Immediate | rd ← ux(rs1) « ux(imm) | 1 |
| SRLI rd,rs1,imm | Shift Right Logical Immediate | rd ← ux(rs1) » ux(imm) | 2 |
| SRAI rd,rs1,imm | Shift Right Arithmetic Immediate | rd ← sx(rs1) » ux(imm) | 2 |
| ADD rd,rs1,rs2 | Add | rd ← sx(rs1) + sx(rs2) | 1 |
| SUB rd,rs1,rs2 | Subtract | rd ← sx(rs1) - sx(rs2) | 1 |
| SLL rd,rs1,rs2 | Shift Left Logical | rd ← ux(rs1) « rs2 | 1 |
| SLT rd,rs1,rs2 | Set Less Than | rd ← sx(rs1) < sx(rs2) | 1 |
| SLTU rd,rs1,rs2 | Set Less Than Unsigned | rd ← ux(rs1) < ux(rs2) | 1 |
| XOR rd,rs1,rs2 | Xor | rd ← ux(rs1) ⊕ ux(rs2) | 2 |
| SRL rd,rs1,rs2 | Shift Right Logical | rd ← ux(rs1) » rs2 | 2 |
| SRA rd,rs1,rs2 | Shift Right Arithmetic | rd ← sx(rs1) » rs2 | 2 |
| OR rd,rs1,rs2 | Or | rd ← ux(rs1) ∨ ux(rs2) | 2 |
| AND rd,rs1,rs2 | And | rd ← ux(rs1) ∧ ux(rs2) | 2 |
| MUL rd,rs1,rs2 | Multiply | rd ← ux(rs1) × ux(rs2) | 1 |
| MULH rd,rs1,rs2 | Multiply High Signed Signed | rd ← (sx(rs1) × sx(rs2)) » xlen | 1 |
| MULHSU rd,rs1,rs2 | Multiply High Signed Unsigned | rd ← (sx(rs1) × ux(rs2)) » xlen | 1 |
| MULHU rd,rs1,rs2 | Multiply High Unsigned Unsigned | rd ← (ux(rs1) × ux(rs2)) » xlen | 1 |
| DIV rd,rs1,rs2 | Divide Signed | rd ← sx(rs1) ÷ sx(rs2) | 2 |
| DIVU rd,rs1,rs2 | Divide Unsigned | rd ← ux(rs1) ÷ ux(rs2) | 2 |
| REM rd,rs1,rs2 | Remainder Signed | rd ← sx(rs1) mod sx(rs2) | 2 |
| REMU rd,rs1,rs2 | Remainder Unsigned | rd ← ux(rs1) mod ux(rs2) | 2 |
RISC Zero ECALL Operations
RISC-V specifies a mechanism for environment calls (ecalls), which may be specified by the vendor. In RISC Zero's zkVM, ecalls are specified for a number of core operations. A short description and associated cycle counts are listed below.
| Selector | Description | Operations | Cycles |
|---|---|---|---|
| HALT | Halt execution | Set system exit code to a0. Load 32-bytes output digest from [a1]. Set output digest global. Halt execution. | 1 + paging |
| SOFTWARE | Receive data from the host | Write host-provided data to the memory range [a0 .. a0 + a1 * 4] | 1 + ⌈ a1 / 4 ⌉ + paging |
| SHA-256 | SHA-256 hash | Compute the Merkle–Damgård compression of the region [a2 .. a2 + a3 * 64] with initial state [a1]. Write the digest to [a0]. | 6 + 68 * a2 + paging |
| BIGINT | 256-bit modular operation | if a1 = 0, [a0] ← [a2] ⋅ [a3] (mod [a4]) | 10 + paging |
Footnotes
-
Here "sampling" is in quotes because the profiler actually captures the call stack at every cycle of program execution. Capturing a call stack on every cycle of execution is not done in most programs on physical CPUs for a few reasons:
- It would be cost prohibitive to do so for all but quite short program executions.
- Introducing such heavy profiling would actually alter the performance characteristics in significant ways.
In zkVM execution, executions are generally short and all execution is synchronous and is not subject to any deviations in behavior due to measurement overhead. ↩
-
This is similar to the cryptography support such as AES-NI or the SHA extensions for x86 processors. In both cases, the circuitry is extended to compute otherwise expensive operations in fewer instruction cycles. ↩