Profiling guest code
In this guide, we'll explore how to effectively profile guest code within the RISC0 ZKVM, offering insights and tools to improve performance. We'll be using three different implementations of the Fibonacci sequence calculation to demonstrate how to profile guest code. You can find all the code used as example in the profiling example.
Overview
Guest code
There are three different Fibonacci sequence calculation methods provided in the profiling example:
fibonacci_1: A basic iterative method.fibonacci_2: An optimized iterative method that attempts to batch computation.fibonacci_3: A matrix exponentiation approach, which is a fast method to compute Fibonacci numbers.
The guest code reads the number of iterations from the host, computes the Fibonacci number using all the above methods, and finally commits the answer back to the host.
Host code
Here's are the step to enable profiling:
- Enable the
profilefeature of thezkvmin yourCargo.toml.
risc0-zkvm = { version = "0.19", features = ["profiler"] }
- Initialize the profiler with your guest code.
let mut profiler = Profiler::new("profile_output_path", FIBONACCI_ELF);
This will initialize the profiler using the FIBONACCI_ELF as guest code, and will write the output of the profiling to profile_output_path.
Alternatively, you can define the profile_output_path using an env variable:
let pprof_out = match std::env::var("RISC0_PPROF_OUT") {
    Ok(val) => Some(val),
    Err(_) => None,
};
let mut profiler = match pprof_out {
    Some(path) => Some(Profiler::new(&path, FIBONACCI_ELF).expect("profiler creation failed")),
    None => None,
};
- Build the executor environment
let iterations = 1000;
let env = {
    let mut builder = ExecutorEnv::builder();
    if let Some(ref mut p) = profiler {
        builder.trace_callback(p.make_trace_callback());
    }
    builder
        .write_slice(&[iterations])
        .build()
        .expect("environment build failed")
};
- Execute the guest code
let exec = default_executor();
exec.execute_elf(env, FIBONACCI_ELF).expect("execution failed");
This will only execute the guest code, without generating a receipt.
- Write out the profile
if let Some(ref mut p) = profiler {
    p.finalize();
    let report = p.encode_to_vec();
    std::fs::write(pprof_out.as_ref().unwrap(), &report)
        .expect("Unable to write profiling output");
}
Usage
Step 1: Prerequisites
First, install the pprof tool with
go install github.com/google/pprof@latest
Step 2: Running
Then, run the example with:
RISC0_PPROF_OUT=./profile.pb cargo run --release
The above command will execute the Fibonacci computation for 1000 iterations and write the profiling output to profile.pb.
Step 3: Visualization
To visualize the profiling data using pprof, run:
pprof -http=127.0.0.1:8089 ../target/riscv-guest/riscv32im-risc0-zkvm-elf/release/fibonacci profile.pb
Then navigate to http://localhost:8089 in your browser.
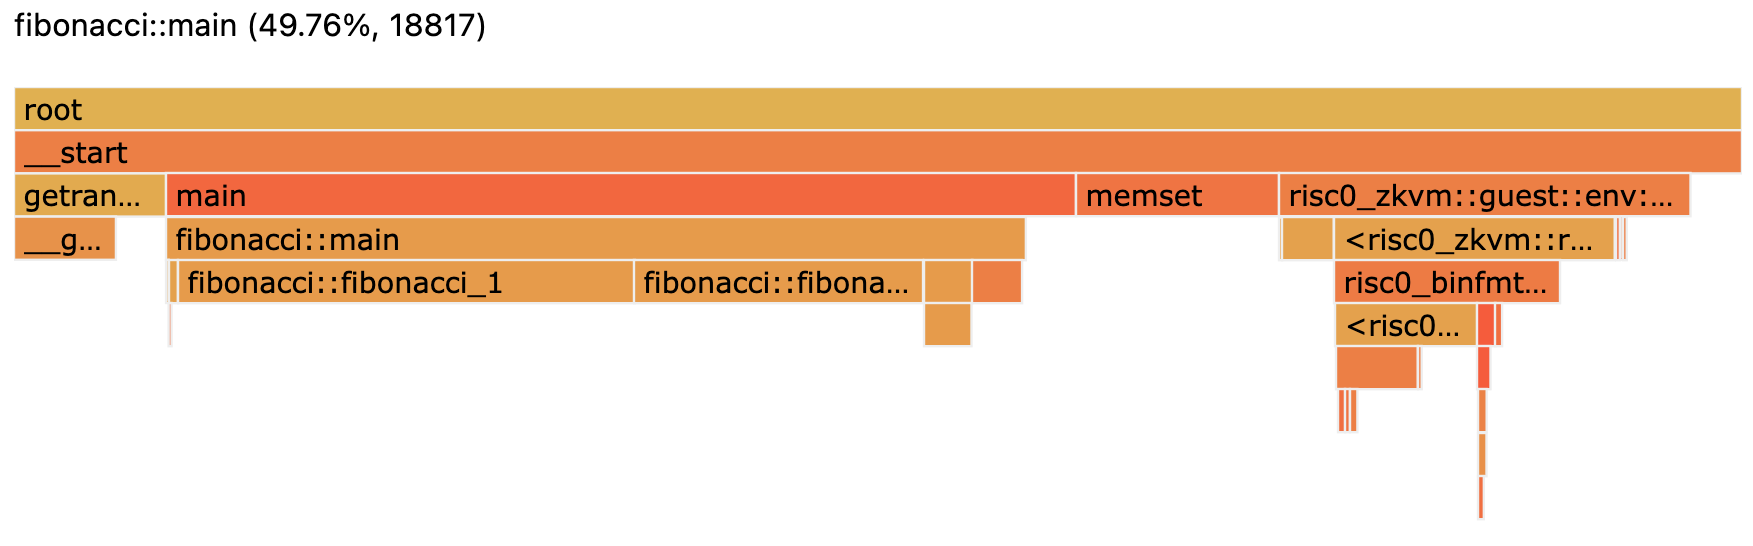
What to Expect
When you visualize the profiling data, you should be able to see the relative performance in terms of cycle count of the three Fibonacci implementations. This can be helpful in understanding the efficiency of various algorithms and their performance implications.

Notes
- Ensure that the environment variable
RISC0_PPROF_OUTis set to the desired output path for the profiling data. - The Fibonacci functions are annotated with
#[inline(never)]and#[no_mangle]to ensure that their symbols are easily recognizable in the profiling data. - The
black_boxfunction is used to prevent the compiler from optimizing out the calculations. - To maximize the number of nodes visualized by pprof you can add
-edgefraction 0 -nodefraction 0 -nodecount 100000when starting pprof.